Click over your location to view the forecast. Three separate ways to view the same forecast are available; the daily forecast for the next 15 days, the 72 hour forecast shown in hourly format and the 24 hour graph.
|
|
Local Forecasts provide hourly and daily forecasts. These forecasts are frequently updated every hour to provide you with the latest weather information throughout the day. Forecast data will be provided by the forecast point closest to your location unless you have purchased custom Site Specific Forecasts.
The data available in the 15 Day local forecast is determined
by edition. Not all data is available in all editions of MxVision
AviationSentry Online
The 15 Day forecast provides one day of observed data and 12 days of forecast data. The first 3 days (72 hours) of the forecast data are updated hourly. The remaining days are updated several times a day. For a more detailed forecast of today's outlook view the Hourly Forecast for your location.
Click a location on the layered map.
View the 15 Day forecast and
yesterday's observed data.
The first day of the15 Day forecast provides an outlook for the rest of the day - from this hour forward, rather than the entire midnight to midnight period (which could include past events). This “looking forward only” approach is useful especially when precipitation is in the forecast.
Note: The low and high temperatures of both actual and feels like represent the daily (midnight to midnight) low/high forecast or observation It will be the observed low and/or high if its already occurred, and the forecasted low and/or high if it hasn’t.

At 7am (shown above) the weather condition showed "All day Snow Likely"
with an accumulation of 7-10 inches.
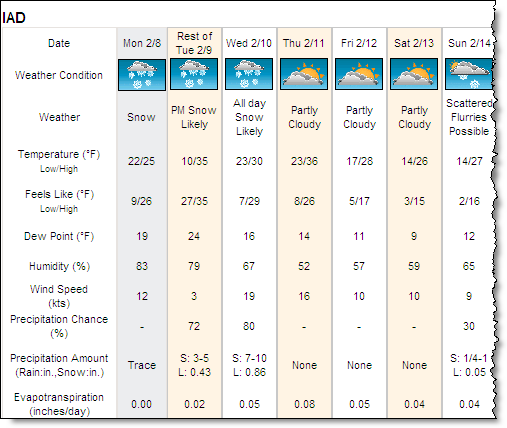
By 4pm (shown above) the weather condition was updated to "PM Snow Likely" for the Rest of Tuesday. The amount of snow in the forecast has also been updated. This is because only the amount of precipitation yet to fall during the Rest of Tuesday is shown in the graphic. The hourly forecast is available for a more detailed hour by hour view.
The hourly forecast includes 12 hours of observed conditions and 72 hours forecast data. The forecast will include your threshold parameters.
Select the Hourly tab.
View the Hourly forecast.
Scroll ahead to view 72 hours of forecast data and scroll back to view
observed data.

In colder months precipitation may fall as snow rather than rain. Precipitation Type includes the characteristic of the snow.
|
|
Wet = Temperature Forecast during the snow event is >
26 degrees F NRM = Temperature Forecast during the snow event is 19-26
degrees F Dry = Temperature Forecast during the snow event is <19
degrees F |
Precip Amount represents the forecast snow accumulation for a three hour period. Both S (snow total) and L (liquid total) are provided.
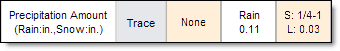
Rain = Rain, depicted in inches (in) or millimeters (mm)
S = Snow, depicted in inches (in) or centimeters (cm)
L = Liquid equivalent of snow, depicted in inches (in) or millimeters (mm)
Graphs depict 12 hours of observed data and 24 hours of forecast data. Graphs will include your threshold parameters.
Select the Graphs tab.
Not all graph data is available
in all editions.

Note: Blowing Snow Potential refers to observed and forecast surface snow which may cause pavement hazards. Snow which is currently falling is not taken into consideration in the Blowing Snow Potential forecast.
Available
in the MxVision AviationSentry
Select the Calendar tab.
The 15-Day forecast of moon
phases, rise and set times, illumination, moon age and other valuable
data is available for night operations.

![]()
