Airport Brief and Route Brief now include several colorized graphs for observed and forecast parameters.
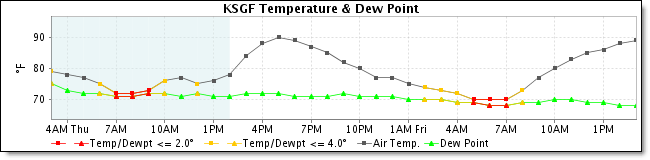
The graph will display the data for both temperature and dewpoint for each station selected (one graph per station). Temperature will be displayed in black and dewpoint in green. However, if the temp-dewpoint spread is less than or equal to four degrees F (2 degrees C) both lines will be plotted in orange. If the temp-dewpoint spread is less than or equal to two degrees F (1 degrees C) both lines will be plotted in red.
The units will conform to the English or metric units used throughout AviationSentry Online.
The graph will NOT conform to the user selections for Hourly Forecast Threshold Settings.
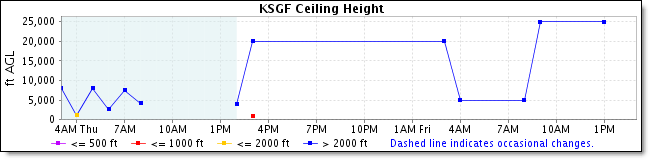
The last 12 hours of observed cloud data and the next 24 hour forecast from the decoded TAF are shown. If no TAF is available, the graph will display only the data from the observed METAR location. Each station selected will be displayed in a separate graph.
The graph will display the ceiling, either broken or overcast, (requiring at least 6/10 sky coverage) for each station selected. No data will be displayed for scattered or clear conditions. The units will conform to the English or metric units used throughout AviationSentry Online.
|
Cloud Height |
Color |
|
CIG > 600 meters (2000 feet) |
Blue |
|
1000 feet < CIG <=600 meters (2000 feet) |
Orange |
|
500 feet < CIG <= 300 meters (1000 fee t) |
Red |
|
0 feet CIG <= 150 meters (500 feet0 |
Purple |
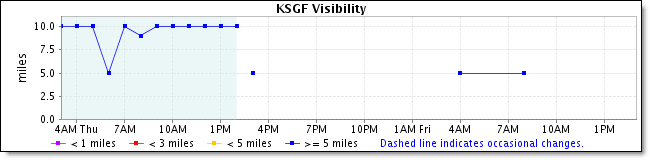
The last 12 hours observed visibility data and the next 24 hour forecast from the decoded TAF are shown. If no TAF is available, the graph will display only the data from the observed METAR location. Each station selected will be displayed in a separate graph. The units will conform to the English or metric units used throughout AviationSentry Online.
|
Cloud Height |
Color |
|
VIS >= 8000 meters (5 miles) |
Blue |
|
3 miles <= VIS < 8000 meters (5 miles) |
Orange |
|
1 mile <= VIS <= 4800 meters (3 miles) |
Red |
|
0 miles<= VIS < 1600 meters (1 mile) |
Purple |
![]()
![]()